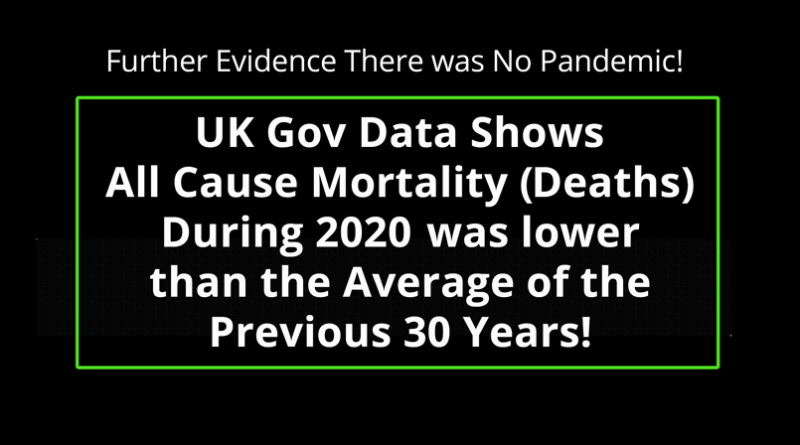
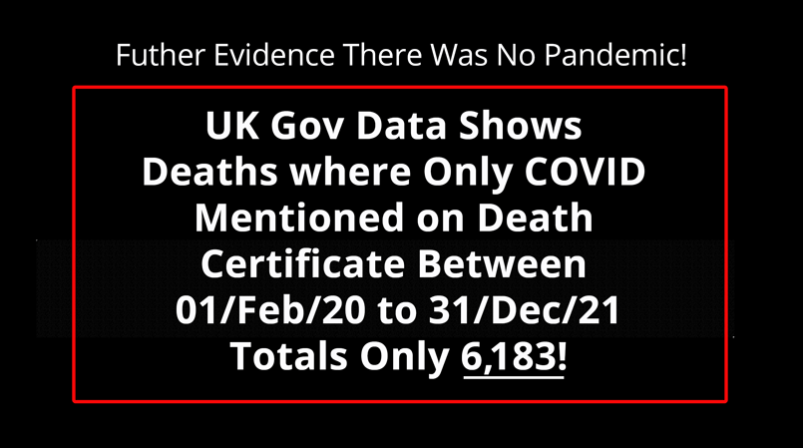
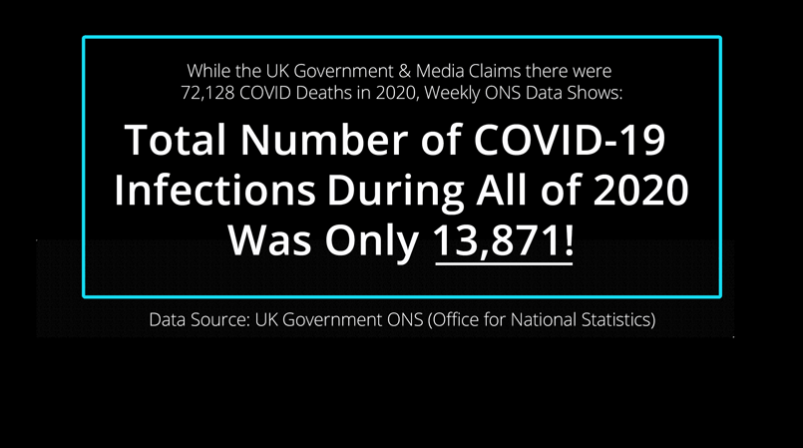
UK FOI Request Shows Fewer Deaths in 2020 Than the Average of the Previous 30 Years! So where was the huge increased due to the Pandemic in 2020?
Due to all the ‘in your face’ daily televised and hyped up reports and hysteria generated both by government and the media (including massive amounts of government advertising), most people (including doctors) was led believe that a huge amount of excess deaths occurred throughout 2020 than in previous years. Remember also, that there were apparently no flu related deaths during that period!
However, a basic analysis of the official UK ONS (Office for National Statistics) data – which can easily be conducted by anyone -, reveals that the average number of ‘all cause mortality (age standardized) deaths per 100,000 people’ in England and Wales’ in 2020 (a figure provided by ONS) was lower than the average over the 30 year period prior to 2020 (i.e. 1989 to 2019)!
That average ‘all cause mortality (age standardized) deaths per 100,000 people’ over the 30 year period 1989 to 2019 was 1,225.97.
And, surprisingly for most people, the average for the year 2020 was lower than the average of the previous 30 years at 1047!
So, whilst the government and the captured media wants you to believe that we were in a pandemic which was killing an inordinate number of the population, the simple and undeniable fact is that there were fewer deaths in 2020 than the average of the previous 30 years!
| Year | Number of Deaths | Population (thousands) | Age-Standardized Mortality Rate (per 100,000 population) |
| 1989 | 576,872 | 50,408 | 1,514 |
| 1990 | 564,846 | 50,561 | 1,462.60 |
| 1991 | 570,044 | 50,748 | 1,464.30 |
| 1992 | 558,313 | 50,876 | 1,415.00 |
| 1993 | 578,512 | 50,986 | 1,453.40 |
| 1994 | 551,780 | 51,116 | 1,374.90 |
| 1995 | 565,902 | 51,272 | 1,392.00 |
| 1996 | 563,007 | 51,410 | 1,372.50 |
| 1997 | 558,052 | 51,560 | 1,350.80 |
| 1998 | 553,435 | 51,720 | 1,327.20 |
| 1999 | 553,532 | 51,933 | 1,320.20 |
| 2000 | 537,877 | 52,140 | 1,266.40 |
| 2001 | 532,498 | 52,360 | 1,236.20 |
| 2002 | 535,356 | 52,602 | 1,231.30 |
| 2003 | 539,151 | 52,863 | 1,232.10 |
| 2004 | 514,250 | 53,152 | 1,163.00 |
| 2005 | 512,993 | 53,575 | 1,143.80 |
| 2006 | 502,599 | 53,951 | 1,104.30 |
| 2007 | 504,052 | 54,387 | 1,091.80 |
| 2008 | 509,090 | 54,842 | 1,091.90 |
| 2009 | 491,348 | 55,235 | 1,033.80 |
| 2010 | 493,242 | 55,692 | 1,017.10 |
| 2011 | 484,367 | 56,171 | 978.6 |
| 2012 | 499,331 | 56,568 | 987.4 |
| 2013 | 506,790 | 56,948 | 985.9 |
| 2014 | 501,424 | 57,409 | 953 |
| 2015 | 529,655 | 57,885 | 993.2 |
| 2016 | 525,048 | 58,381 | 966.9 |
| 2017 | 533,253 | 58,745 | 965.3 |
| 2018 | 541,589 | 59,116 | 965.4 |
| 2019 | 530,841 | 59,440 | 925 |
| Total | 36,779.10 |
The average figure over the previous 30 years was calculated by simply summing each of the individual figures in the 4th column of the above table which = 36,779.10 and dividing it by 30 i.e. 36,779.10/30 = 1,225.97.
The above listed figures can be verified by reviewing the data on the UK government website which is linked at: https://www.ons.gov.uk/aboutus/transparencyandgovernance/freedomofinformationfoi/deathsintheukfrom1990to2020
In order to obtain the 1989 figures, you will need to visit a different page on the ONS website which can be found at: https://www.ons.gov.uk/peoplepopulationandcommunity/birthsdeathsandmarriages/deaths/adhocs/12735annualdeathsandmortalityrates1938to2020provisional
The lies we are being told cannot continue indefinitely, no matter how much they try! Despite the complicit Big Media and Big Tech censoring the truthful voices and censoring whistle blowers, too many people are finding out that they are being lied to.
Please also see the following:


